Theory-Based Approach cont.
The central limit theorem, first seen in Chapter 1, applies for quantitative data.|
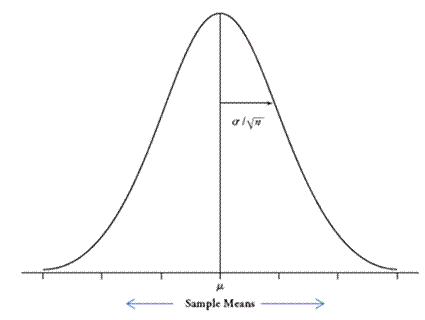
Theoretical Result: If we have either a large sample size (rough guideline: n > 20) OR a normally distributed population, then the sampling distribution of the sample mean is
 |
It's important to keep in mind that these conditions are rough guidelines and not a guarantee.
(n) Would you consider the validity conditions valid for the population we generated? Explain.
It turns out, when we use s/![]() in the denominator instead, the mathematical distribution that best predicts the behavior of the distribution of standardized statistics is called a t-distribution. The shape of the t distribution is still mound-shaped, but it is centered at zero. It looks a lot like a normal distribution but is a bit more spread out than a normal distribution (more observations in the "tails," less in the middle). For this reason, the standardized statistic is often referred to as the t-statistic.
in the denominator instead, the mathematical distribution that best predicts the behavior of the distribution of standardized statistics is called a t-distribution. The shape of the t distribution is still mound-shaped, but it is centered at zero. It looks a lot like a normal distribution but is a bit more spread out than a normal distribution (more observations in the "tails," less in the middle). For this reason, the standardized statistic is often referred to as the t-statistic.

